Unlock the power of creativity!

© tomasknopp - Modern infographic for company organizational structure. Easy to use for your website or presentation.

Modern infographic for company organizational structure. Easy to use for your website or presentation.

© Gorodenkoff - Diverse Modern Office: Motivated Businessman Leads Business Meeting with Managers, Talks, uses Presentation TV with Statistics, Chart Growth, Big Data. Digital Entrepreneurs Work on e-Commerce Project

Diverse Modern Office: Motivated Businessman Leads Business Meeting with Managers, Talks, uses Presentation TV with Statistics, Chart Growth, Big Data. Digital Entrepreneurs Work on e-Commerce Project

© vectorfusionart - Transition effect in bar chart statistics and bright windows

Transition effect in bar chart statistics and bright windows

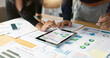
© N F/peopleimages.com - Business people, data analysis with tablet and paperwork, hands with online review in meeting and team with market research. Statistics, analytics dashboard and digital infographic with collaboration

Business people, data analysis with tablet and paperwork, hands with online review in meeting and team with market research. Statistics, analytics dashboard and digital infographic with collaboration

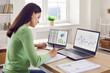
© Studio Romantic - Analyst woman reviews charts and graphs on laptops. She reviews metrics at a bright office desk, notes trends in a notebook, and interprets performance. Clear concept of data analytics.

Analyst woman reviews charts and graphs on laptops. She reviews metrics at a bright office desk, notes trends in a notebook, and interprets performance. Clear concept of data analytics.

© Phimwilai - Business idea. Business people talking And calculations about charts and graphs showing the growth of investment results Of successful teamwork

Business idea. Business people talking And calculations about charts and graphs showing the growth of investment results Of successful teamwork

© VideoFlow - Handsome businessman in suit at workplace working with laptop to optimize IPO strategy. Financail chart hologram over office background

Handsome businessman in suit at workplace working with laptop to optimize IPO strategy. Financail chart hologram over office background

© NicoElNino - Project manager working on Gantt chart to update the schedule, tasks and milestones progress for the team. Management diagram on computer screen with person coordinating teamwork.

Project manager working on Gantt chart to update the schedule, tasks and milestones progress for the team. Management diagram on computer screen with person coordinating teamwork.

© artitwpd - A business professional is using a laptop computer to view financial data. The graphs and charts on the screen show that the company is doing well. The professional is pleased with the results.

A business professional is using a laptop computer to view financial data. The graphs and charts on the screen show that the company is doing well. The professional is pleased with the results.

© fizkes - Charts, graphs, analysis sales information on laptop screen view over financier shoulder, visual representation of financial data, using helpful app for make analyze easier. Project statistics concept

Charts, graphs, analysis sales information on laptop screen view over financier shoulder, visual representation of financial data, using helpful app for make analyze easier. Project statistics concept

© Freedomz - Team of creative graphic designer working on color swatch samples chart for selection coloring in inspiration to create new collection at workplace

Team of creative graphic designer working on color swatch samples chart for selection coloring in inspiration to create new collection at workplace

© VectorMine - Stress curve educational diagram with performance level graph outline concept

Stress curve educational diagram with performance level graph outline concept

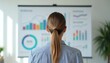
© miss irine - Woman presents business growth charts on whiteboard. Professional analyzes data, planning future strategy. Team meeting, corporate analytics, finance success, workplace collaboration.

Woman presents business growth charts on whiteboard. Professional analyzes data, planning future strategy. Team meeting, corporate analytics, finance success, workplace collaboration.

© moose/peopleimages.com - Search, data analysis or black man hands on tablet in digital agency for company growth, strategy review or KPI graph chart in office. Startup worker for SEO analytics or planning company sale report

Search, data analysis or black man hands on tablet in digital agency for company growth, strategy review or KPI graph chart in office. Startup worker for SEO analytics or planning company sale report

© Pixel-Shot - Banner for Workplace Eye Wellness Month with eye test chart and magnifier

Banner for Workplace Eye Wellness Month with eye test chart and magnifier

© ChasingMagic/peopleimages.com - Businessman, meeting and coaching in presentation for data, graph or chart on team project at office. Man, coach or mentor training staff on corporate statistics, analytics or marketing at workplace

Businessman, meeting and coaching in presentation for data, graph or chart on team project at office. Man, coach or mentor training staff on corporate statistics, analytics or marketing at workplace

© IMG visuals icons - Top workplace safety violations vector infographic template. Hazard presentation design elements. Data visualization with 5 steps. Process timeline chart. Workflow layout with linear icons

Top workplace safety violations vector infographic template. Hazard presentation design elements. Data visualization with 5 steps. Process timeline chart. Workflow layout with linear icons

© BullRun - Young businessman and woman in formal sitting in office using tablet working on financial charts in workplace in company

Young businessman and woman in formal sitting in office using tablet working on financial charts in workplace in company

© Yingyaipumi - Investment Consultant,strategy,planning,Financial advisor and accounting concept.Group of business adviser meeting to analyze and discuss the situation on the financial report workplace office.

Investment Consultant,strategy,planning,Financial advisor and accounting concept.Group of business adviser meeting to analyze and discuss the situation on the financial report workplace office.

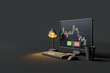
© Antonio Solano - computer screen with candlestick chart and lamp

computer screen with candlestick chart and lamp

© tomasknopp - Modern infographic for project or organization structure - blue version. Simple flat template for data visualization.

Modern infographic for project or organization structure - blue version. Simple flat template for data visualization.

© InfiniteFlow - Collaborative Work and Artificial Intelligence Integration in a Modern Office Setting with Technology and Data Analytics Elements. Amity

Collaborative Work and Artificial Intelligence Integration in a Modern Office Setting with Technology and Data Analytics Elements. Amity

© Dusan Petkovic - Two colleagues are sitting at the meeting room and discussing charts and statistics.

Two colleagues are sitting at the meeting room and discussing charts and statistics.

© BuyOutFelix04/peopleimages.com - Doctor, happy woman or reading with clipboard in clinic, medical record or writing instructions for care plan. Healthcare, patient treatment or person review chart for information, flare or low angle

Doctor, happy woman or reading with clipboard in clinic, medical record or writing instructions for care plan. Healthcare, patient treatment or person review chart for information, flare or low angle

© PRIME STOCK LAB - Two professional analyzing financial data graphs, charts on laptop display at a modern workspace. Financial analysis or business evaluation concept

Two professional analyzing financial data graphs, charts on laptop display at a modern workspace. Financial analysis or business evaluation concept

© SK - Modern Business Workspace: A modern office setup with a businessman analyzing financial charts on a computer

Modern Business Workspace: A modern office setup with a businessman analyzing financial charts on a computer

© PURPLE VISION STUDIO - Focused magnifying glass checking stock market chart depicts serious financial analysis strategy. Digital business investment data research aids trading growth economic graph for profit success

Focused magnifying glass checking stock market chart depicts serious financial analysis strategy. Digital business investment data research aids trading growth economic graph for profit success

© ACHJIMA - Businessman using AI technology for data analysis automation intelligent software virtual assistant smart tools digital transformation workplace innovation machine learning

Businessman using AI technology for data analysis automation intelligent software virtual assistant smart tools digital transformation workplace innovation machine learning

© HyFal - Office Icon Set – Hand Drawn Business and Work Symbols with Desk, Laptop, Document, Coffee, Meeting, Presentation, and Stationery Tools for Productivity, Workplace, and Corporate Design

Office Icon Set – Hand Drawn Business and Work Symbols with Desk, Laptop, Document, Coffee, Meeting, Presentation, and Stationery Tools for Productivity, Workplace, and Corporate Design

© fizkes - Diverse colleagues working on project together lead by african female

Diverse colleagues working on project together lead by african female

© Sagor - Business strategy planning and project management flat vector illustration set with team brainstorming workflow charts analytics presentation and office collaboration scenes isolated design.

Business strategy planning and project management flat vector illustration set with team brainstorming workflow charts analytics presentation and office collaboration scenes isolated design.

© al-sultan - Bright modern office lobby interior with large windows and seating area, creating a welcoming professional ambience with soft glowing highlights and smooth visual depth throughout the space.

Bright modern office lobby interior with large windows and seating area, creating a welcoming professional ambience with soft glowing highlights and smooth visual depth throughout the space.

© Barirotul - Diverse team celebrating success with high fives in modern office

Diverse team celebrating success with high fives in modern office

© peopleimages.com - Investor, reading and woman in office, documents for economy stats and profit growth for company. Mature person, financial advisor and paperwork for trading charts and report for investment audit

Investor, reading and woman in office, documents for economy stats and profit growth for company. Mature person, financial advisor and paperwork for trading charts and report for investment audit

© visoot - A person analyzing data on their laptop, with the screen showing graphs and tables of traffic analytics. close up. Generative AI.

A person analyzing data on their laptop, with the screen showing graphs and tables of traffic analytics. close up. Generative AI.

© Studio Marmellata - High angle of crop anonymous female office workers sitting at table with laptop and paper charts while discussing and working on project together in office

High angle of crop anonymous female office workers sitting at table with laptop and paper charts while discussing and working on project together in office

© Pete - Nurse works with computer at station. Doctor analyses patients data. Young medical worker types on keyboard. Woman checks electronic health records on monitors in modern clinic. Healthcare

Nurse works with computer at station. Doctor analyses patients data. Young medical worker types on keyboard. Woman checks electronic health records on monitors in modern clinic. Healthcare

© IMG visuals icons - Consulting job types infographic 5 steps. Human resources. Financial control, budgeting. Flow chart infochart. Editable vector info graphics icons. Montserrat-SemiBold, Regular fonts used

Consulting job types infographic 5 steps. Human resources. Financial control, budgeting. Flow chart infochart. Editable vector info graphics icons. Montserrat-SemiBold, Regular fonts used

© Atchariya63 - Close up of a person's hands working on a laptop with data analysis graphs and charts on the screen.  A smartphone sits on the table.

Close up of a person's hands working on a laptop with data analysis graphs and charts on the screen. A smartphone sits on the table.

Dedicated professional utilizing advanced multi-monitor setup to meticulously analyze complex financial market data, enabling informed investment decisions and strategic business development

© Animation_vector - Vector graphic of three people analyzing various charts and graphs on a monitor. One person is in a wheelchair, another stands with a tablet, and the third sits at a desk with a laptop.

Vector graphic of three people analyzing various charts and graphs on a monitor. One person is in a wheelchair, another stands with a tablet, and the third sits at a desk with a laptop.

© Johannes - a team of business executives in formal attire discussing strategy and planning during a meeting in a modern office setting

a team of business executives in formal attire discussing strategy and planning during a meeting in a modern office setting

© Creative mind - Business people analyzing dashboard for data analysis and business performance concepts.

Business people analyzing dashboard for data analysis and business performance concepts.

Corporate team standing around large table with charts documents and data analysis presenting strategic planning collaboration and modern business meeting concept

© Iryna - Incident report message on lined card with magnifying glass, pen, charts and calculator symbolizing workplace

Incident report message on lined card with magnifying glass, pen, charts and calculator symbolizing workplace

© Designpics - Woman Asleep On The Job

Woman Asleep On The Job

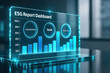
© rungnapha - Futuristic ESG report dashboard, holographic interface, blue neon charts, environmental social governance metrics modern office, corporate data

Futuristic ESG report dashboard, holographic interface, blue neon charts, environmental social governance metrics modern office, corporate data

© Kanlayarawit - A partial body close-up of a man wearing a red scotch shirt is touching a tablet with hologram graphic diagrams of business bar chart above it on a blurred workplace background.

A partial body close-up of a man wearing a red scotch shirt is touching a tablet with hologram graphic diagrams of business bar chart above it on a blurred workplace background.

© Nuttapong punna - Project manager working and update tasks with milestones progress planning and Gantt chart scheduling diagram. business working with smart phone, tablet and laptop

Project manager working and update tasks with milestones progress planning and Gantt chart scheduling diagram. business working with smart phone, tablet and laptop

© Mitthila Vectx - Isometric illustration of a busy corporate office, showcasing diverse employees engaged in data analysis, meetings, and presentations.

Isometric illustration of a busy corporate office, showcasing diverse employees engaged in data analysis, meetings, and presentations.

© PAJDJW - businessman planing and using holographic in the office workplace for work progress about investment and money management with trading chart  financial plan to making and calculate passive incomes

businessman planing and using holographic in the office workplace for work progress about investment and money management with trading chart financial plan to making and calculate passive incomes

© Piya W. - Detailed closeup hand holds clipboard analyzing operational risk assessment matrix chart to ensure safety and security focused workplace

Detailed closeup hand holds clipboard analyzing operational risk assessment matrix chart to ensure safety and security focused workplace

© 沈军 贡 - A calculator and financial charts on an office desk, with a laptop in the background, displaying graphs of growth data.

A calculator and financial charts on an office desk, with a laptop in the background, displaying graphs of growth data.

© sderbane - Doctor writing survey, insurance and claim form for medical paperwork, document and script for patient records

Doctor writing survey, insurance and claim form for medical paperwork, document and script for patient records

© Stockphotodirectors - Two team members sit at a table in a bright office. They look at charts and graphs on paper while discussing strategies and promoting success together.

Two team members sit at a table in a bright office. They look at charts and graphs on paper while discussing strategies and promoting success together.

© ChasingMagic/peopleimages.com - Businessman, meeting and coaching on screen for data, graph or chart in team presentation at office. Man, coach or mentor training staff on corporate statistics, analytics or marketing at workplace

Businessman, meeting and coaching on screen for data, graph or chart in team presentation at office. Man, coach or mentor training staff on corporate statistics, analytics or marketing at workplace

© MIND AND I - Businesswoman sitting at desk on couch in workplace or at home working on laptop and analyzing data on charts and graphs and writing on papers to make business plan and strategies for company

Businesswoman sitting at desk on couch in workplace or at home working on laptop and analyzing data on charts and graphs and writing on papers to make business plan and strategies for company

© Dragon Claws - Group of office employees working at a round pie chart shaped table with a single desk being isolated. Illustration of the concept of workplace bullying and lack of teamwork

Group of office employees working at a round pie chart shaped table with a single desk being isolated. Illustration of the concept of workplace bullying and lack of teamwork

© IMG visuals icons - Positive work environment infographic 4 steps. Workspace management, professional growth. Flow chart infochart. Editable vector info graphics icons. Montserrat-SemiBold, Regular fonts used

Positive work environment infographic 4 steps. Workspace management, professional growth. Flow chart infochart. Editable vector info graphics icons. Montserrat-SemiBold, Regular fonts used

© Art AI Gallery - Group of business people discussing the charts and graphs showing the results of their successful teamwork


Group of business people discussing the charts and graphs showing the results of their successful teamwork